
Over the past few days, trading activities on Ethereum have triggered significant volatility, with the price of ETH dancing within the USD 2,860 – 3,030 range.
In particular, the crypto has conquered, then lost and regained, the psychological level of 3,000 USD several times, opening the doors to very interesting future scenarios.
Kraken OTC analysts are particularly optimistic and predict a target of USD 5,200, located at the upper limit of the current ascending triangle chart formation.
Let’s see all the details below.
Strong volatility in crypto trading: Ethereum aims high
These days, Ethereum traders are generating a lot of volatility on the price of ETH, with the crypto’s prices fluctuating by around 170 points.
The uncertainty in the price action of Bitcoin, which was rejected by the bears in the USD 53,000 area on Tuesday 20 February, and the fears relating to a possible contraction of the US tech securities sector, have caused turmoil in the ether crypto markets.
ETH had in fact reached the USD 3,000 threshold for the first time during 2024 during trading last Tuesday, but was immediately rejected by selling pressure that was more substantial than demand.
The following day, in the middle of the night, the coin attempted an assault on the upper part of the cluster, but was unable to do so.
Now, for the third time in just 2 days, it is back above USD 3,000 againimplying that he wants to continue the rally at any cost.
In the world of trading there is a belief that when an asset hits resistance 2 times in a row, the next time should be the right time to leave it behind.
The latest bullish shot could therefore create the ideal conditions for a bullish continuation of Ethereum, with new targets on the horizon.
In such a scenario, we must nevertheless underline that today’s price growth has been driven by the latest ones news relating to the quarterly reports of the American giant NVIDIAwith profits higher than expected ($22.1 billion versus forecasts of $20.55 billion).
The entire US market was buzzing about the microchip company’s earnings results, and a possible negative quarter could have caused the entire speculative asset sector, including Bitcoin and Ethereum, to dump.
Now the ball is in the hands of the second crypto by market capitalization, which must continue its bullish momentum in the ETH-BTC chart triggered last week and lead the rise in prices of all digital assets.
Investor expectations are high, given the rumors of a possible approval in sight by the SEC for new spot ETH ETFswhich would reduce the selling pressure on the market, already limited thanks to the staking performance and base fee burn after the implementation of EIP-1559.
ETH Price Analysis: Kraken OTC Expects USD 5,200 Target
As reported by Kraken OTC, Ethereum trading could result in a new high, located precisely at 5,200 USD where the “ascending triangle” pattern present on the ETH-USD price chart culminates.
The crypto reached an important level last week, marking a foothold above the horizontal trendline connecting the August 2022 and April 2023 highs.
By connecting this trendline with the one formed by the conjunction of the lows of June 2022 and November 2022, we can see the formation of a bullish triangle, the current break of which would give rise to a further rally.
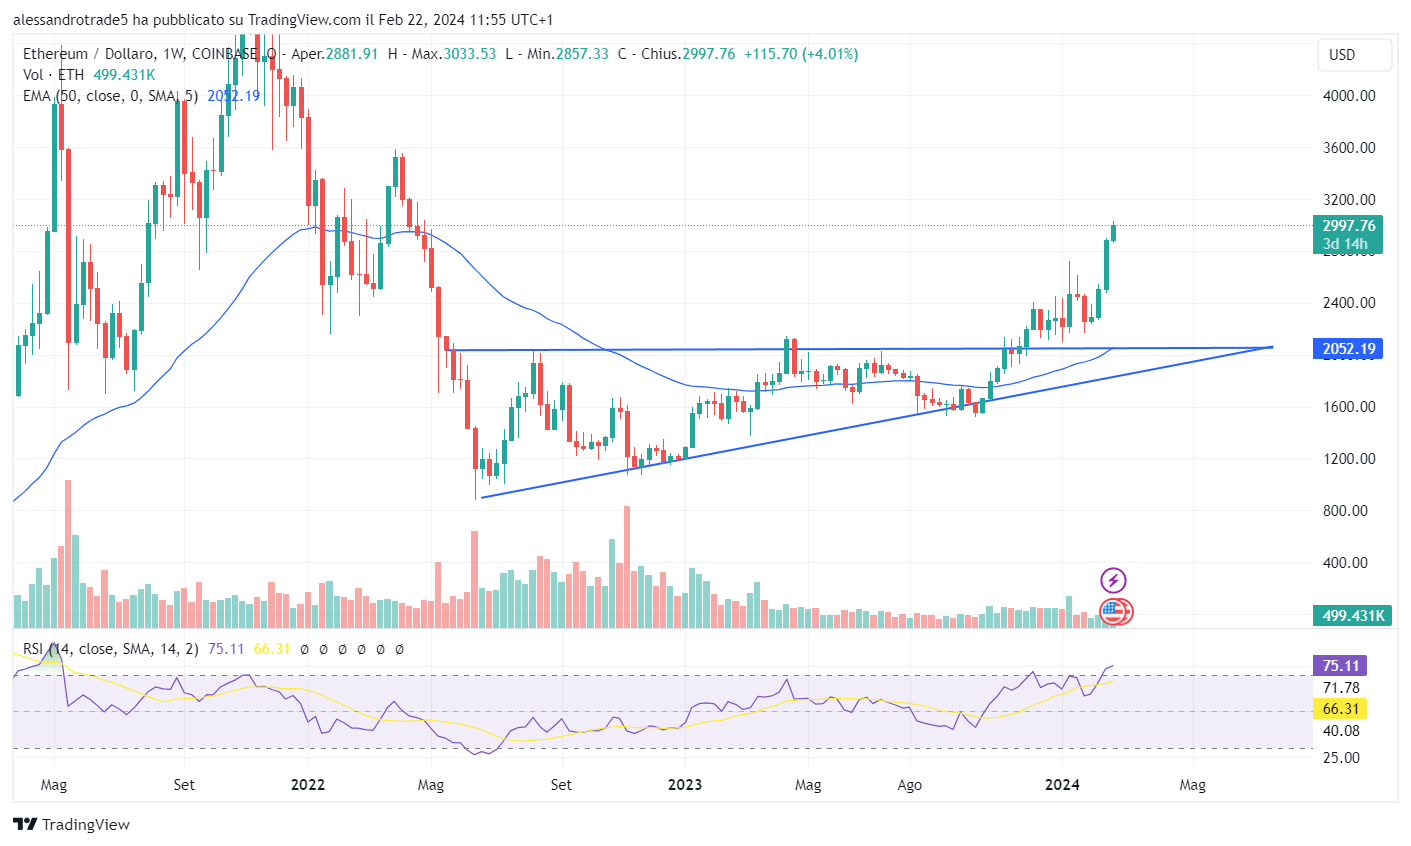
The bulls’ momentum has been compressed for several monthsuntil the moment in which at the end of 2023, ETH broke through the upper area of the triangle, recording a strong price increase and reconquering areas that had not been explored since May 2022.
Furthermore, it should be noted that Ethereum has resisted the weight of the bears over the last few months, remaining above the key level of $2,141, the violation of which would have completely turned the tables on the trading sessions.
In a Condesk newsletter published on Wednesday, Kraken OTC said that the implicit target of this formation is USD 5,200, showing a bullish impetus towards the asset’s short-term future.
In all this, Kraken analysts note that other indicators, such as the Ichimoku cloud, signal the presence of a bullish picture for ETH.
Here are the words of the exchange experts.
“According to the Ichimoku Cloud weekly pattern, ETH is in a decidedly bullish position, trading above the Tenkan-sen, the Kijun-sen and the Ichimoku Cloud itself”
Now all eyes are on Ethereum’s weekly close: at 01.00 AM UTC+1 on Monday 26 Februaryif ETH has managed to resist the downside aggression and finds itself above USD 3,030, the chances of a breakout will increase substantially.
On the contrary, a close below USD 2,850 could trigger a long series of sales. Any closing price contained within these two values would not change the current situation, with uncertainty dominating the markets.
Be careful about placing stop losses that are too tight in these contexts, because the high volatility and the strong speculative component of the derivative markets could cause a spiral of liquidations on both sides of the range.
Source: https://cryptonomist.ch/2024/02/22/trading-ethereum-montagne-russe-prezzo-eth-target-5200-dollari/

