Data from the last 24 hours, updated as of Apr 28. at 8 a.m.
These figures come from the records of maximum temperatures compiled by the State Meteorological Agency (AEMET) since 1950 (or from the first available year after) and analyzed by elDiario.es. The data for each province correspond to the meteorological station located in the capital of each of them that has current observations and the oldest historical series or, in its absence, another station in the province with the same characteristics. Records from other secondary stations from some provinces have also been included. See methodology.
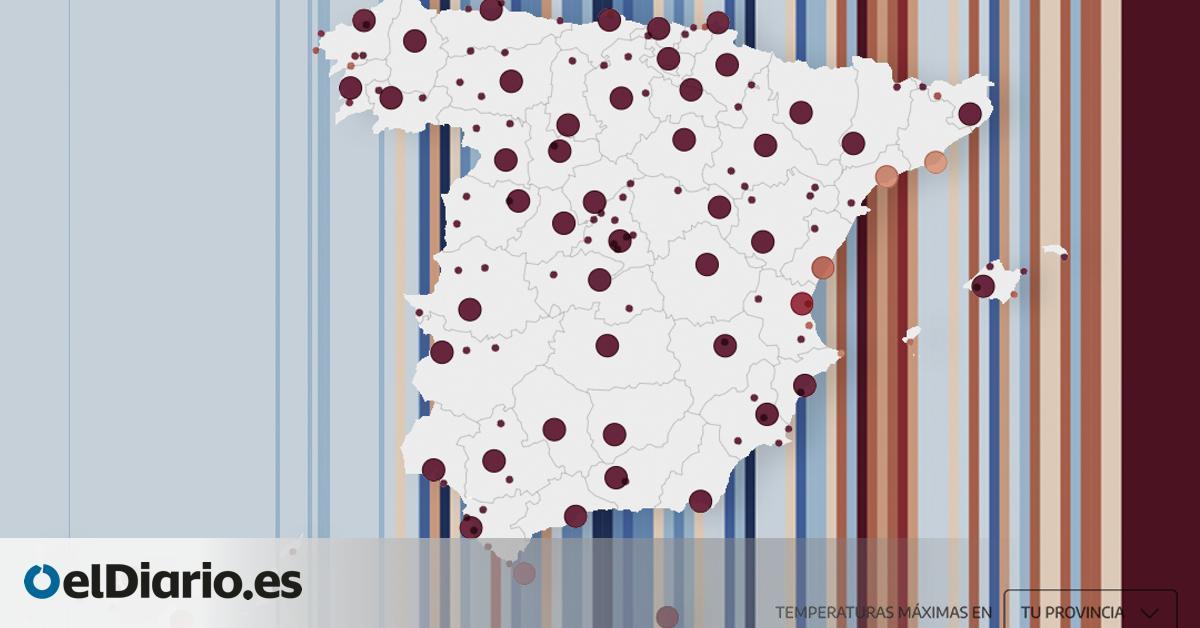
This map shows how many degrees above or below the historical average (period 1981 to 2010) is the highest temperature recorded in the last 24 hours and the average maximum for the year to date.
How hot is it today in your province?
Compare the temperature in your province with the historical average. Difference, in degrees (ºC), of the maximum temperature of the last 24 hours and the annual average over the historical average of the period 1981-2010.
Province
secondary station
Which province registers the maximum temperature furthest away from what it would be for at the time? Is there one that is registering the warmest year since records exist? The AEMET considers the years between 1980 and 2010 as a reference period to calculate the “normal temperatures” in each territory. Based on the difference between the average for that period and the current records, it can be seen if it is hotter today or so far in 2023 than it would be usual.
In the following table, all the provinces are ordered according to the degrees above or below the highest temperature in the last 24 hours with respect to that historical average calculated for the current month and also the same calculation for the average maximum of what that we have this year and the historical average of the same period.
This heat is not normal
Compare the temperature in your province with the historical average. Difference, in degrees (ºC), of the maximum temperature of the last 24 hours and the annual average over the historical average of the period 1981-2010
Much hotter than normal
The current heat is not just a thing of a day. To see if the temperatures of this 2023 are really being higher than usual, we compare the maximums registered so far this year with the reference period.
The scientist Ed Hawkins popularized the use of climate stripes (“weather stripes”), graphics in the form of a bar code SSSSSSSSSS that collect the evolution of the average temperature of any place, compare it with the average for each year and display it with a color code.
How does global warming affect your province? In the following graph you can find how far the average maximum temperatures have been from January 1 to today in each year compared to the average from 1980 to 2010. That is, a reflection of global warming in each AEMET weather station .
warming up in
Difference, in degrees (ºC), of the average of the maximum temperatures of 1 Jan. to 29 apr. of each year with respect to the average of that period between 1981-2010
Source: AEMET
Global warming is a phenomenon that affects the entire planet and the data from the AEMET stations reflect it for Spain. The gradual increase in the maximums reached each year is repeated in all the Spanish provinces.
Is 2023 being especially hot in your area? To see in more detail how this phenomenon is repeated throughout the territory, the following graph shows how far the average maximum temperatures in each year differ from the historical average (1980-2010).
The climate crisis reaches all of Spain
Difference, in degrees (ºC), of the average of the maximum temperatures of 1 Jan. to 29 apr. of each year with respect to the average of that period between 1981-2010
To put the daily maximums of this 2023 in context, in the following graph you can see the evolution of the maximum daily temperature in each province but also the value that would be normal for that day of the year and the highest and lowest extremes previously recorded . With the menu you can consult the evolution of the maximums in any province.
The maxims in
Highs recorded daily in 2023compared to the average of the maxims from 1981 to 2010. In the dark gray stripe are the 90% of maximum temperatures of the historical series registered that day of the year, and the extremes show the highest maximum temperature y more low previously reached on the same day of the year
Source: AEMET
Source: www.eldiario.es