
The recent XRP rise to $2.40 seemed to be the start of another explosive rally. However, the price fell back just as quickly and is now looking for support in the zone above 2 dollars. Technical analyst Erik Juffermans from Newsbit is investigating whether the price can fall even further.
XRP is looking for a tipping point
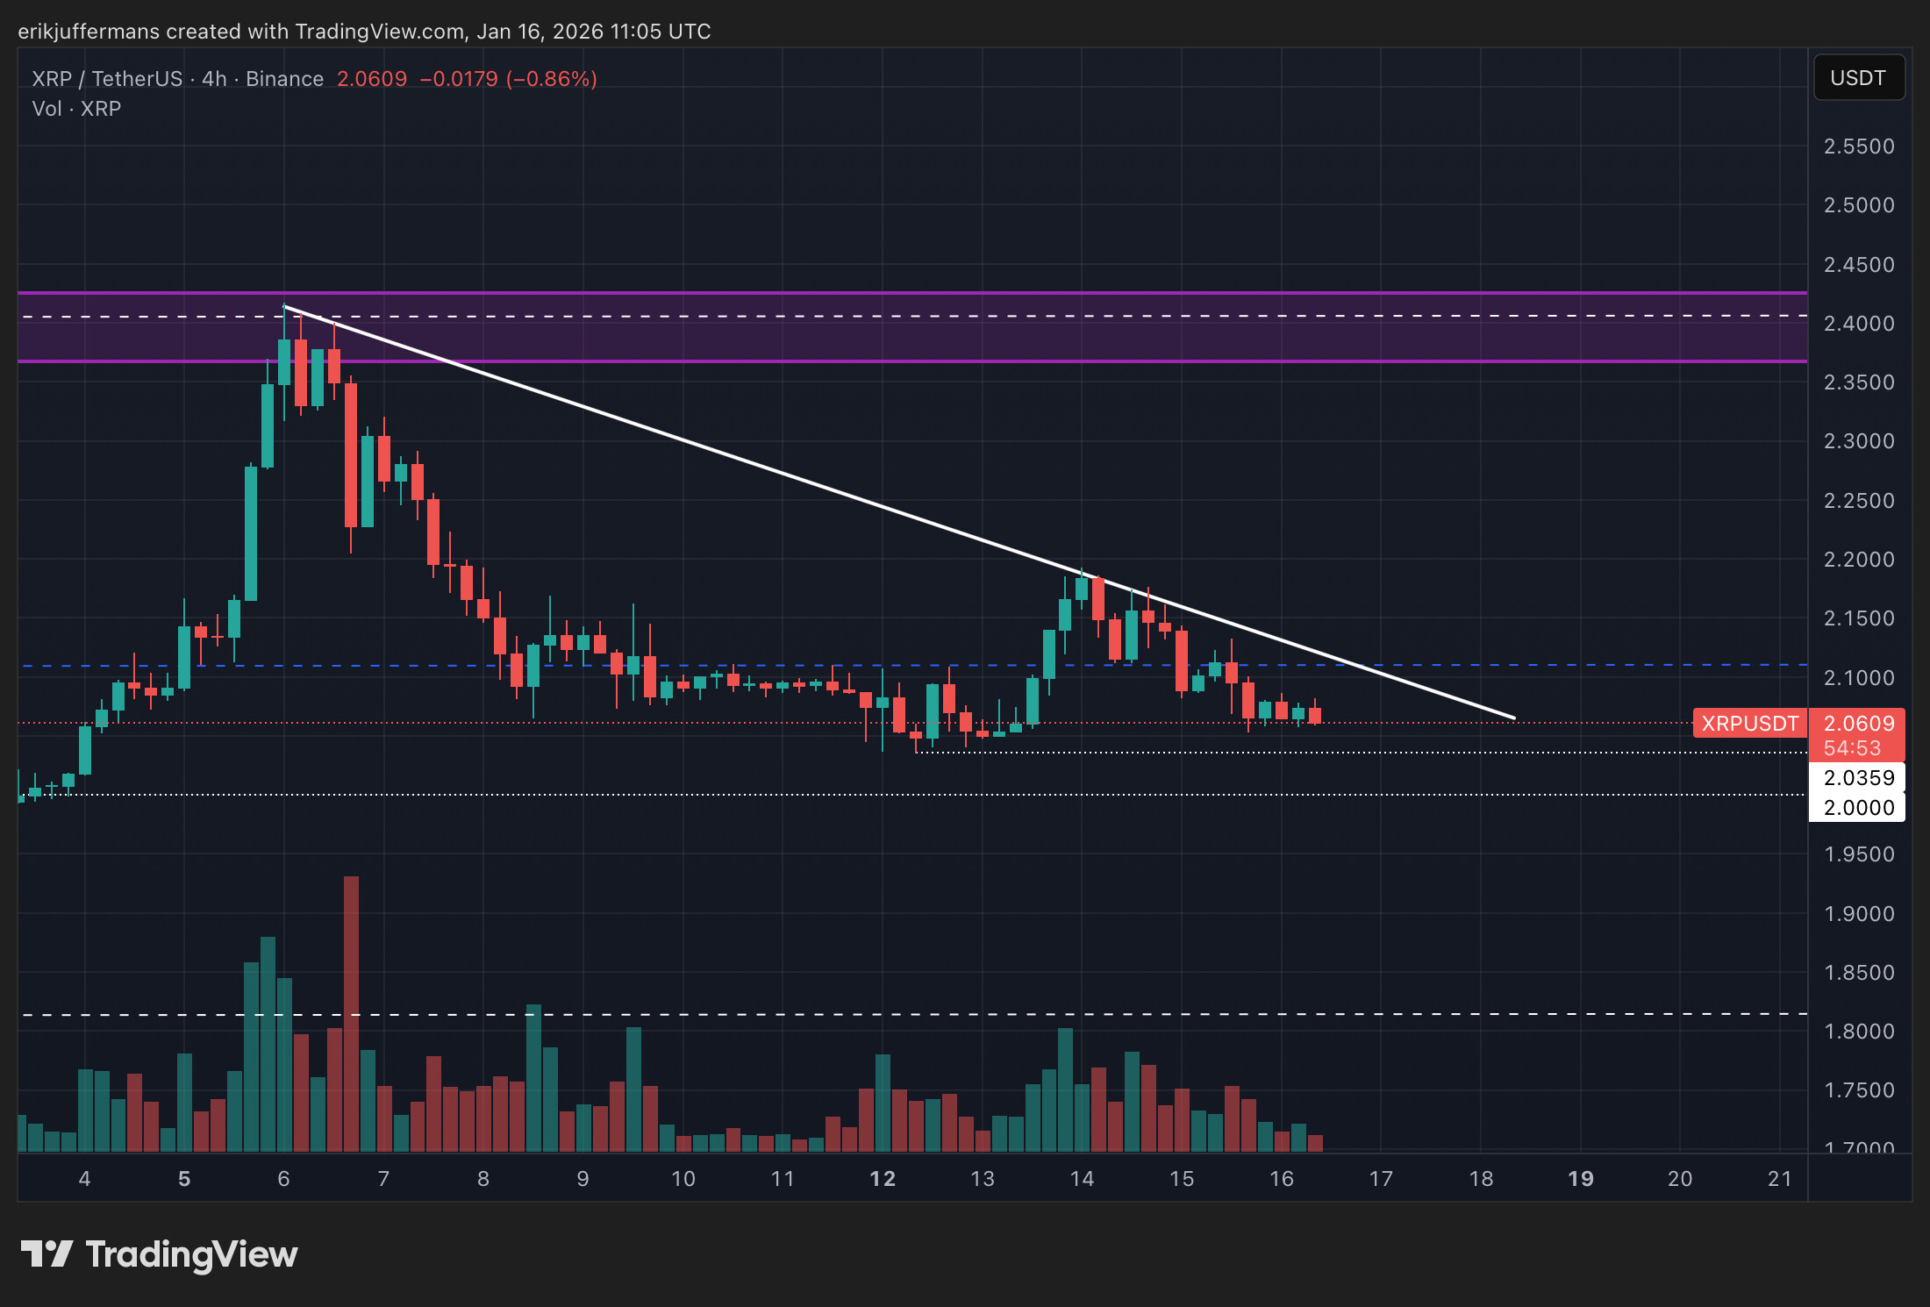
The hourly chart of XRP clearly shows that the price has been trading in a clear correction pattern since the recent peak of $2.18. We therefore have to wait for a breakout from this pattern. A bounce from the current zone is certainly possible. But until this happens, we have to expect a possible drop to $2.
The $2 level is a psychologically significant level. This level was relevant several times in the past year. As a result, this level acts as a kind of magnet for the price.
There is therefore a good chance that the XRP price will make a (short) decline to this zone before starting its upward trajectory again.
The next step to recovery is a break of the downward trend line. In this case, it is likely that we will see a rise towards the resistance zone around 2.40. This is the recent peak of January 6. This is where the real test will take place.
Price target of $3.60?
But to reach the $2.40 level, the price must first deal with another very important resistance level.
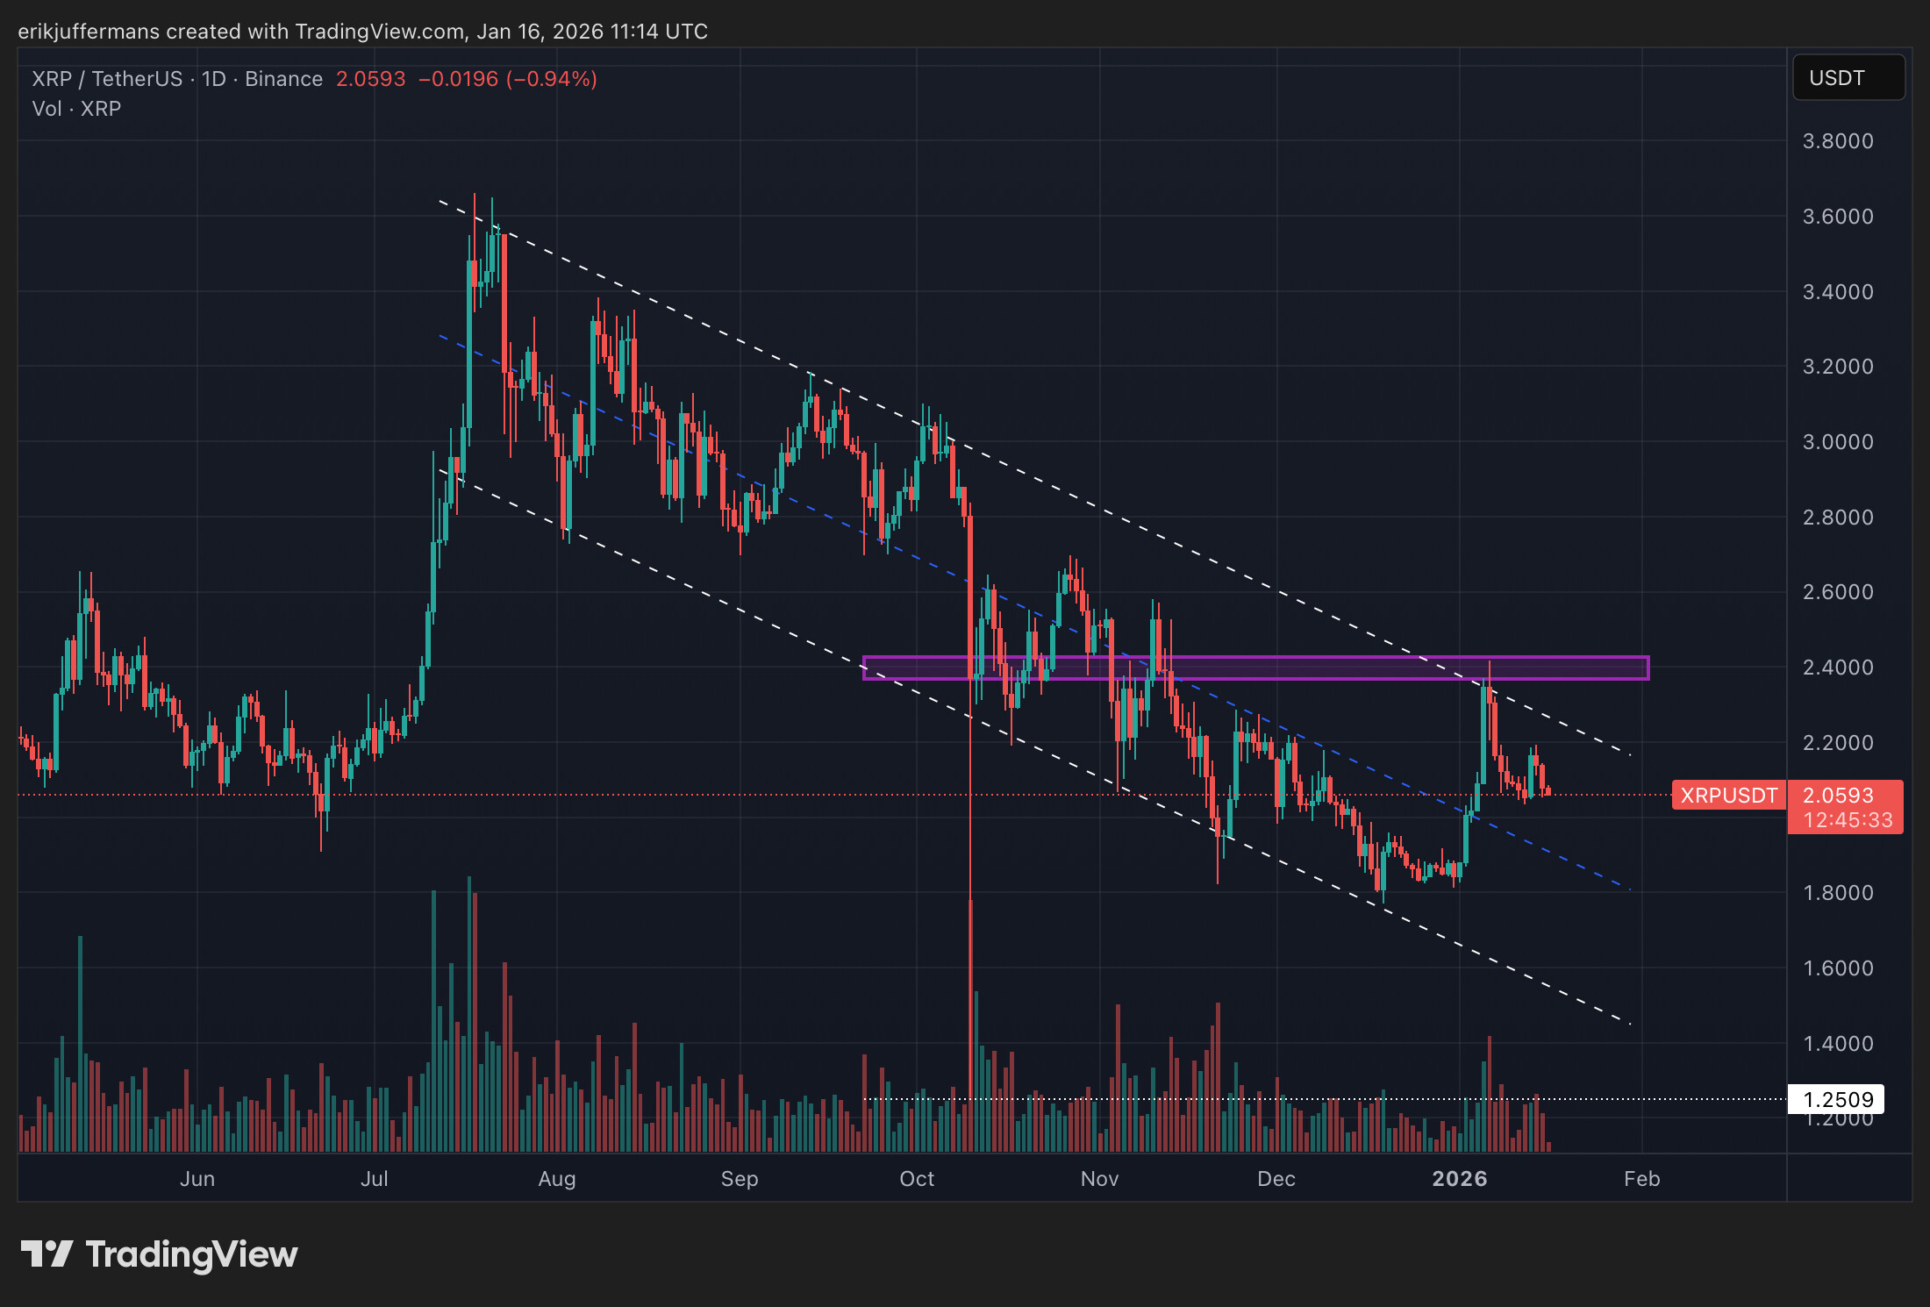
XRP has been trading in a parallel downward channel for six months now. The price swings neatly back and forth between the top and bottom of this channel.
We will therefore have to keep a close eye on the top of this channel once XRP starts rising again. A daily close above this channel would mean a technical price target of the all-time high of more than $3.60.
Source: https://newsbit.nl/xrp-koers-heeft-het-zwaar-maar-newsbit-analist-ziet-kans-op-herstel/