
Ethereum has shown a clear technical improvement for the first time in months. The price has risen almost 4 percent in a week and thus managed to break through a long-term downward trend channel. Yet the work is not done yet. As long as Ethereum fails to make a convincing breakthrough, the risk of a new pullback remains present.
The Ethereum price is therefore at a tipping point: will this be the start of a recovery, or just a temporary revival within a broader weak trend?
Trend break is a fact, confirmation not yet
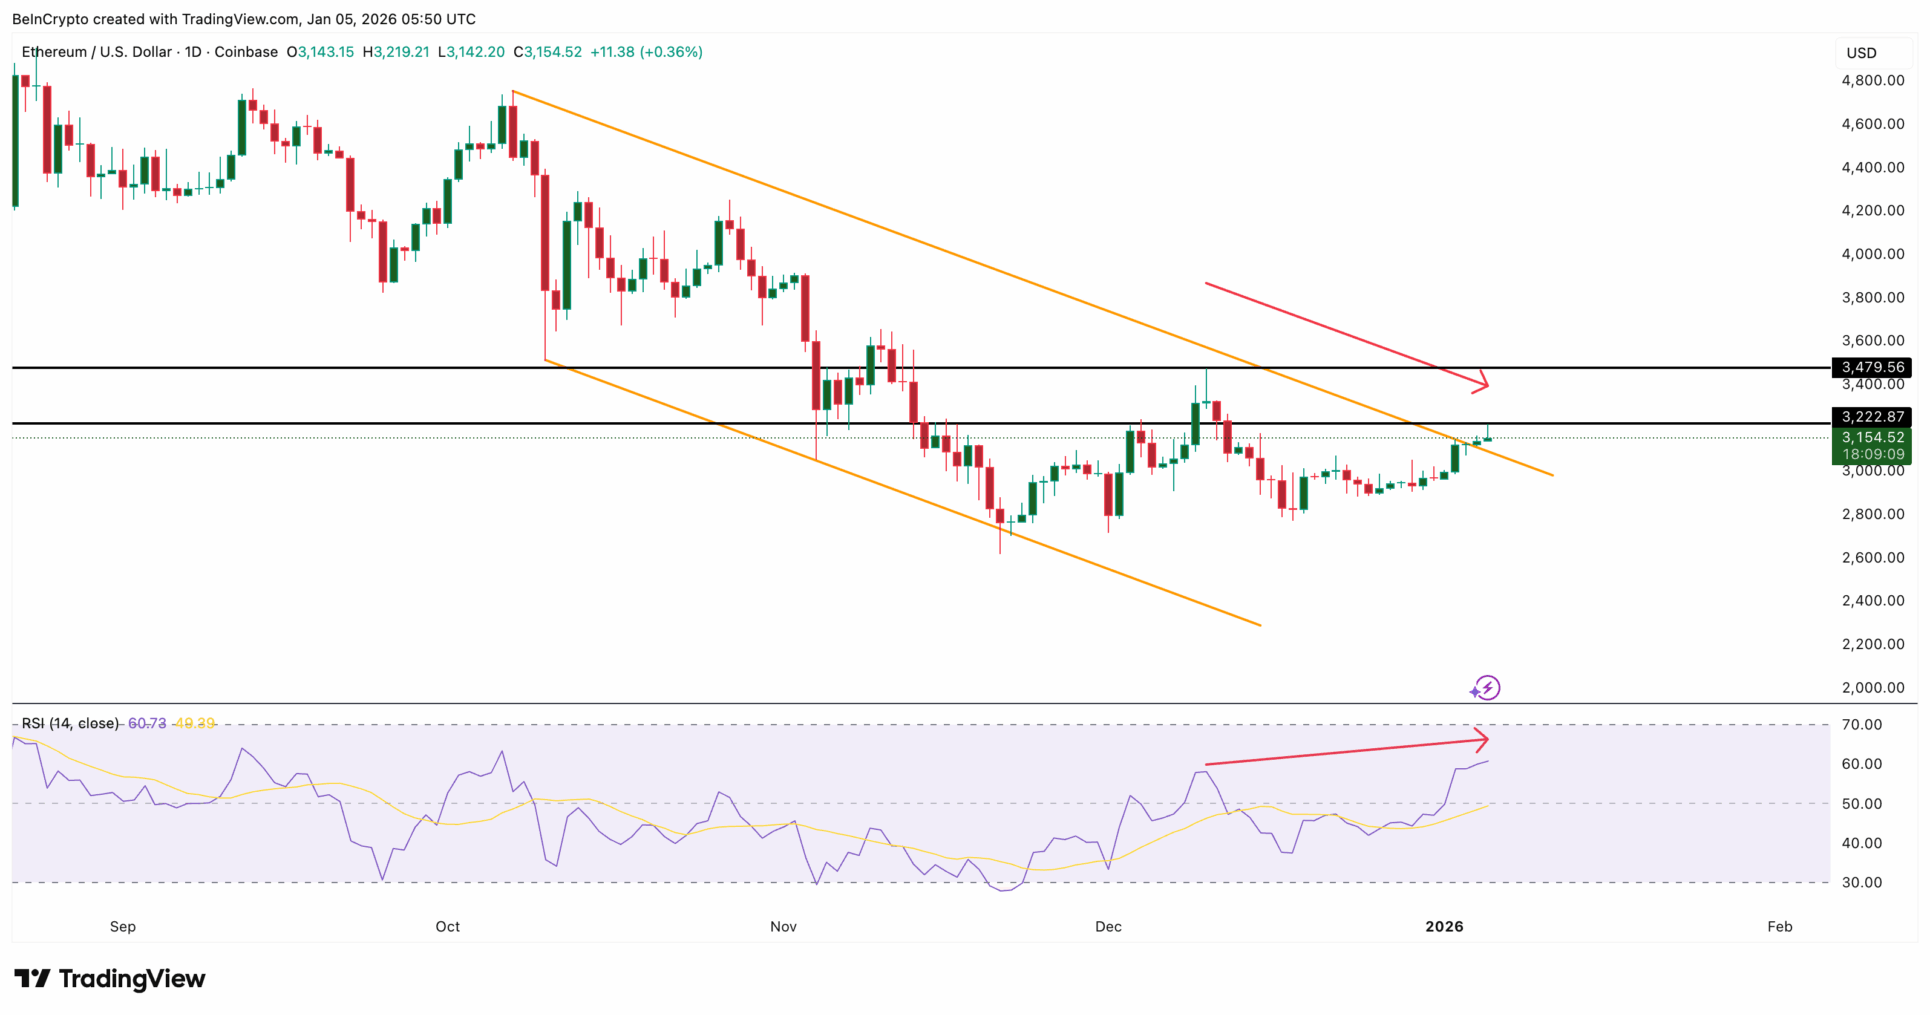
Since early October, Ethereum has been moving within a descending channel, with each upswing ending lower than the last. That structure was broken this week. That’s an important step from a technical perspective, because it signals decreasing selling pressure.
The breakout was preceded by a classic positive divergence: while the price formed lower lows between October and December, the RSI showed higher lows. That signal often indicates an impending trend reversal.
However, the picture is not yet completely clean. In recent weeks, a hidden negative divergence has emerged: the price has set a lower top, while the RSI is actually rising. That pattern more often points to consolidation or a temporary correction than to a powerful breakout. A daily close below $3,220 would confirm this risk.
Leveraged positions pose the greatest risk in the short term
The greatest vulnerability currently is not in the spot market, but in derivatives. On Binance, long positions are extremely dominant. The amount of potential long liquidations is around $2.2 billion, compared to only around $300 million in short liquidations.
The derivatives market is a market in which traders gamble on price movements without actually owning the underlying currency. With a long position you bet on a rising price, and with a short position you bet on a fall. If many traders do this at the same time, often with borrowed money, the market becomes vulnerable: in the event of a small decline, positions are forced to close, which can further push the price down.
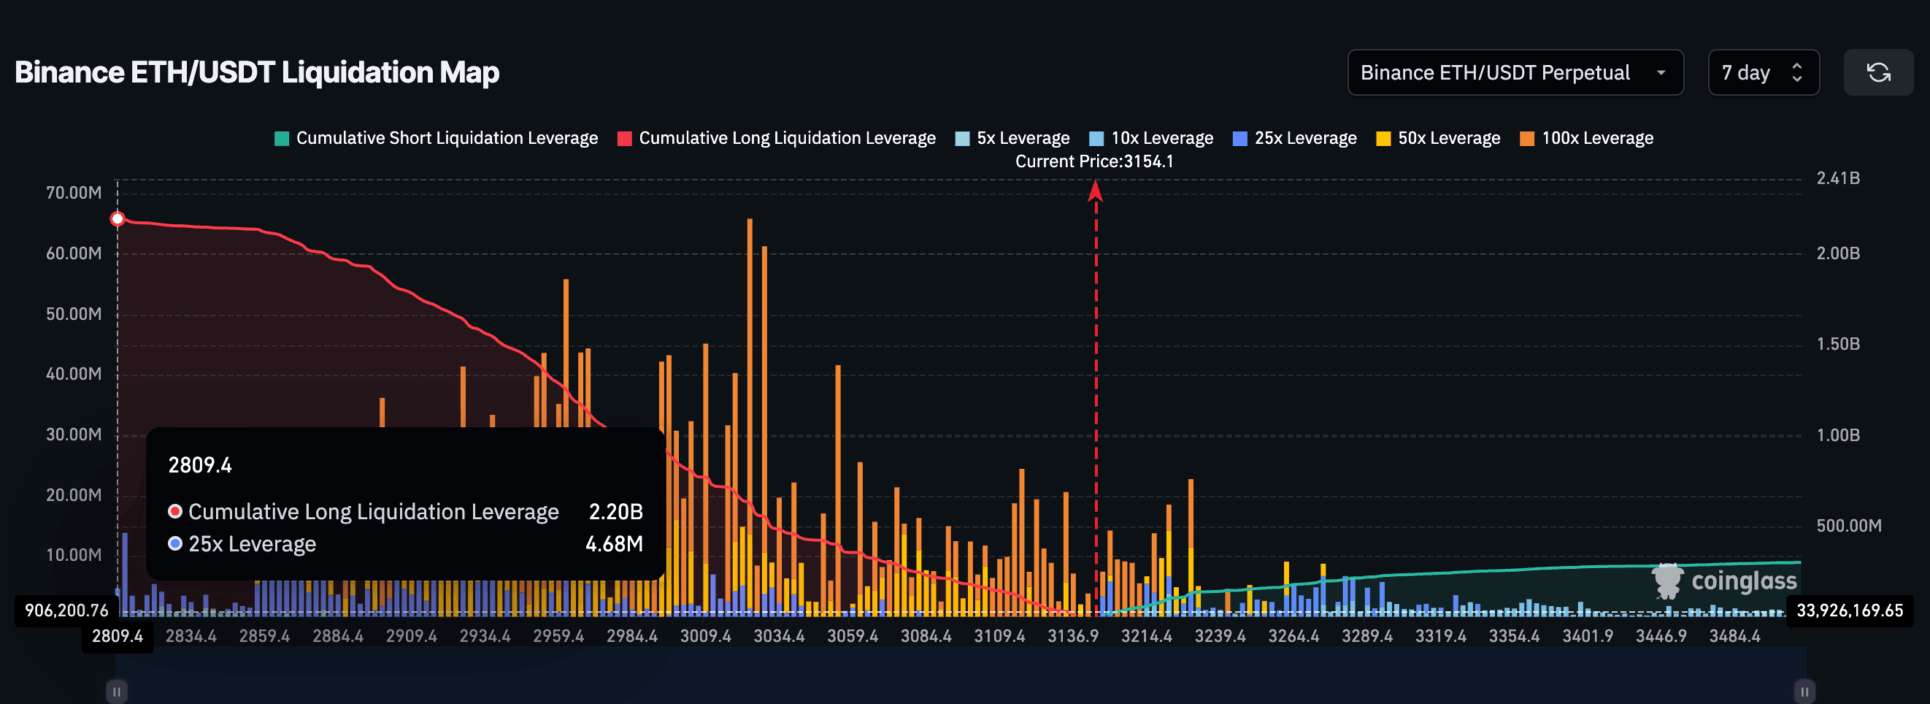
This makes the market sensitive: even a limited decline can cause a chain reaction of liquidations. The heaviest liquidation zone is between $3,150 and $2,850. That area has been acting as support for weeks, but with increasing pressure, that support can quickly break.
Whales provide a counterbalance, but do not eliminate risk
On the other hand, large investors actually accumulate. In one weekend, Ethereum whales added approximately 320,000 ETH to their positions, worth approximately $1 billion. This indicates confidence in higher prices in the medium term.
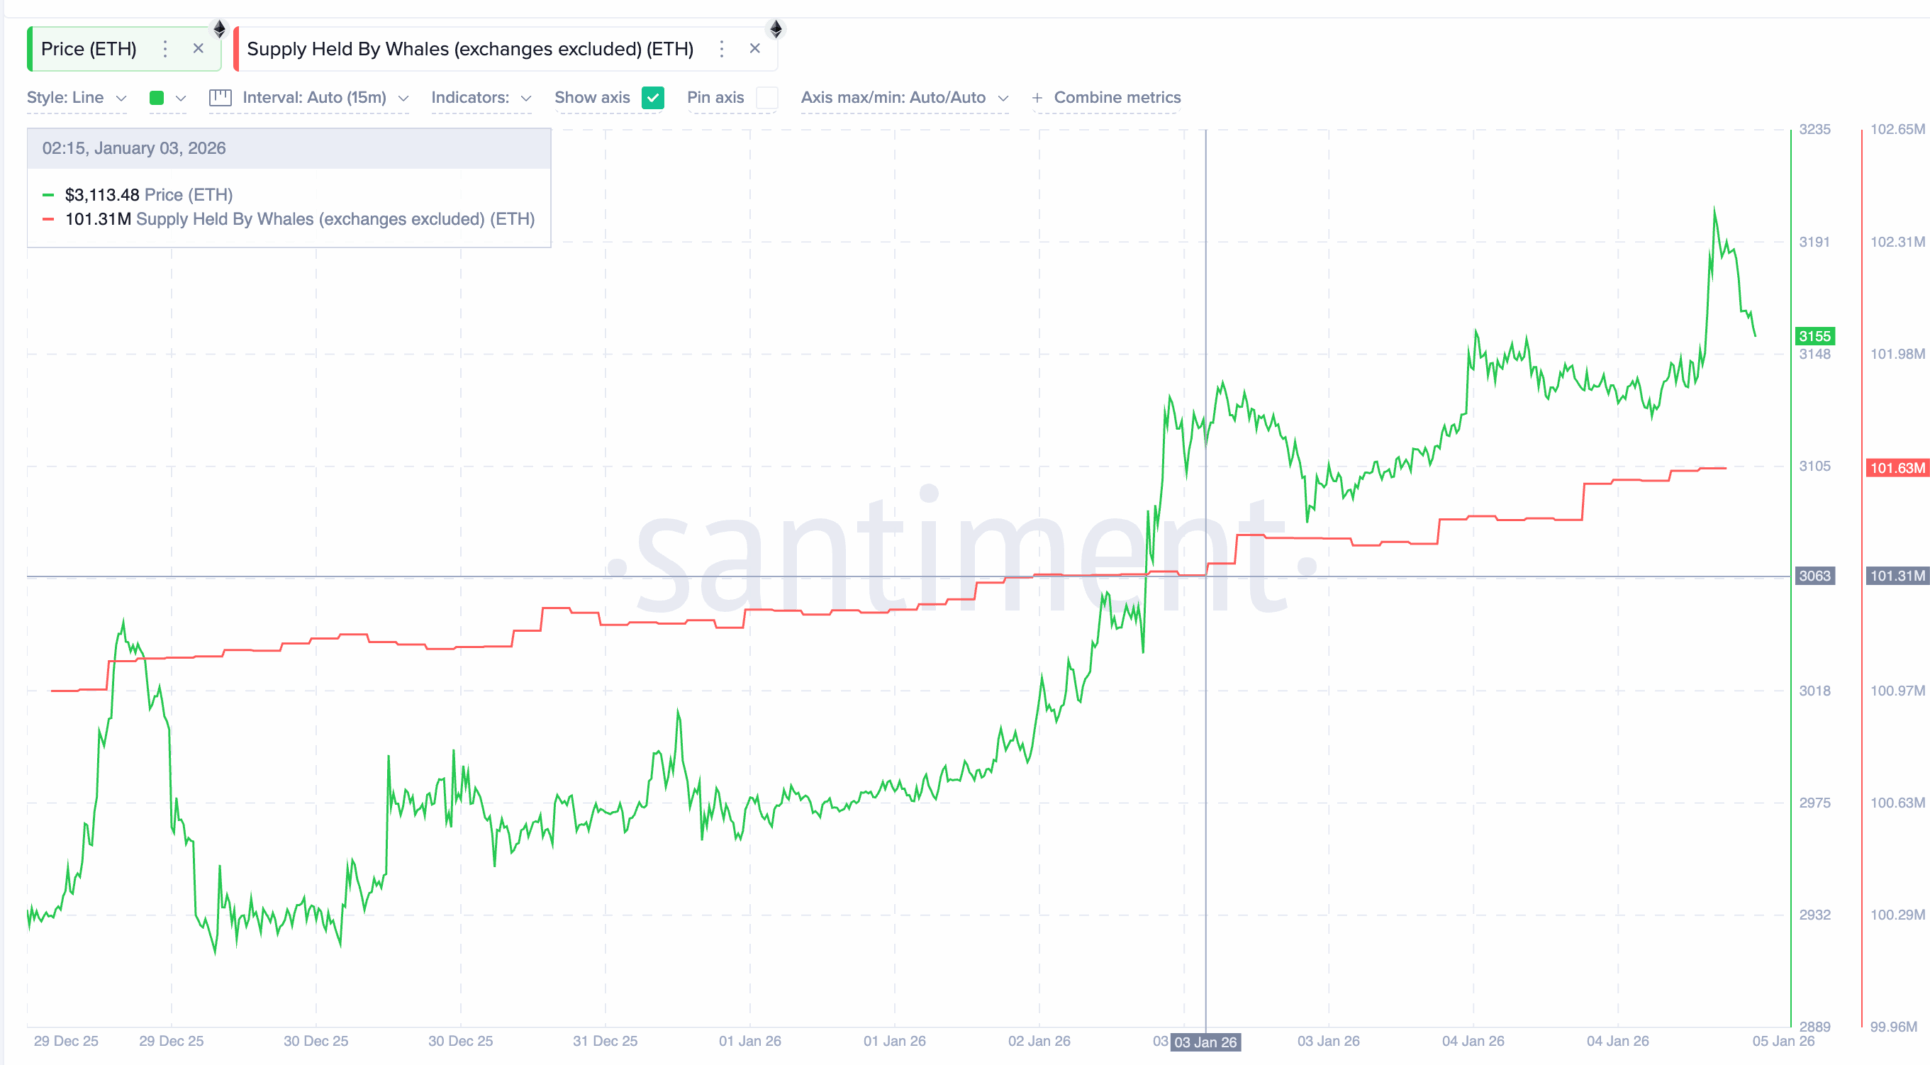
Yet whale accumulation is no guarantee against volatility. It dampens selling pressure, but does not prevent liquidation-driven corrections as long as leverage positions are so one-sided.
These levels determine what happens next
The next few days will revolve around one level: $3,470. A break above that point, about 10 percent above the current price, would invalidate the hidden bearish divergence and confirm the trend reversal.
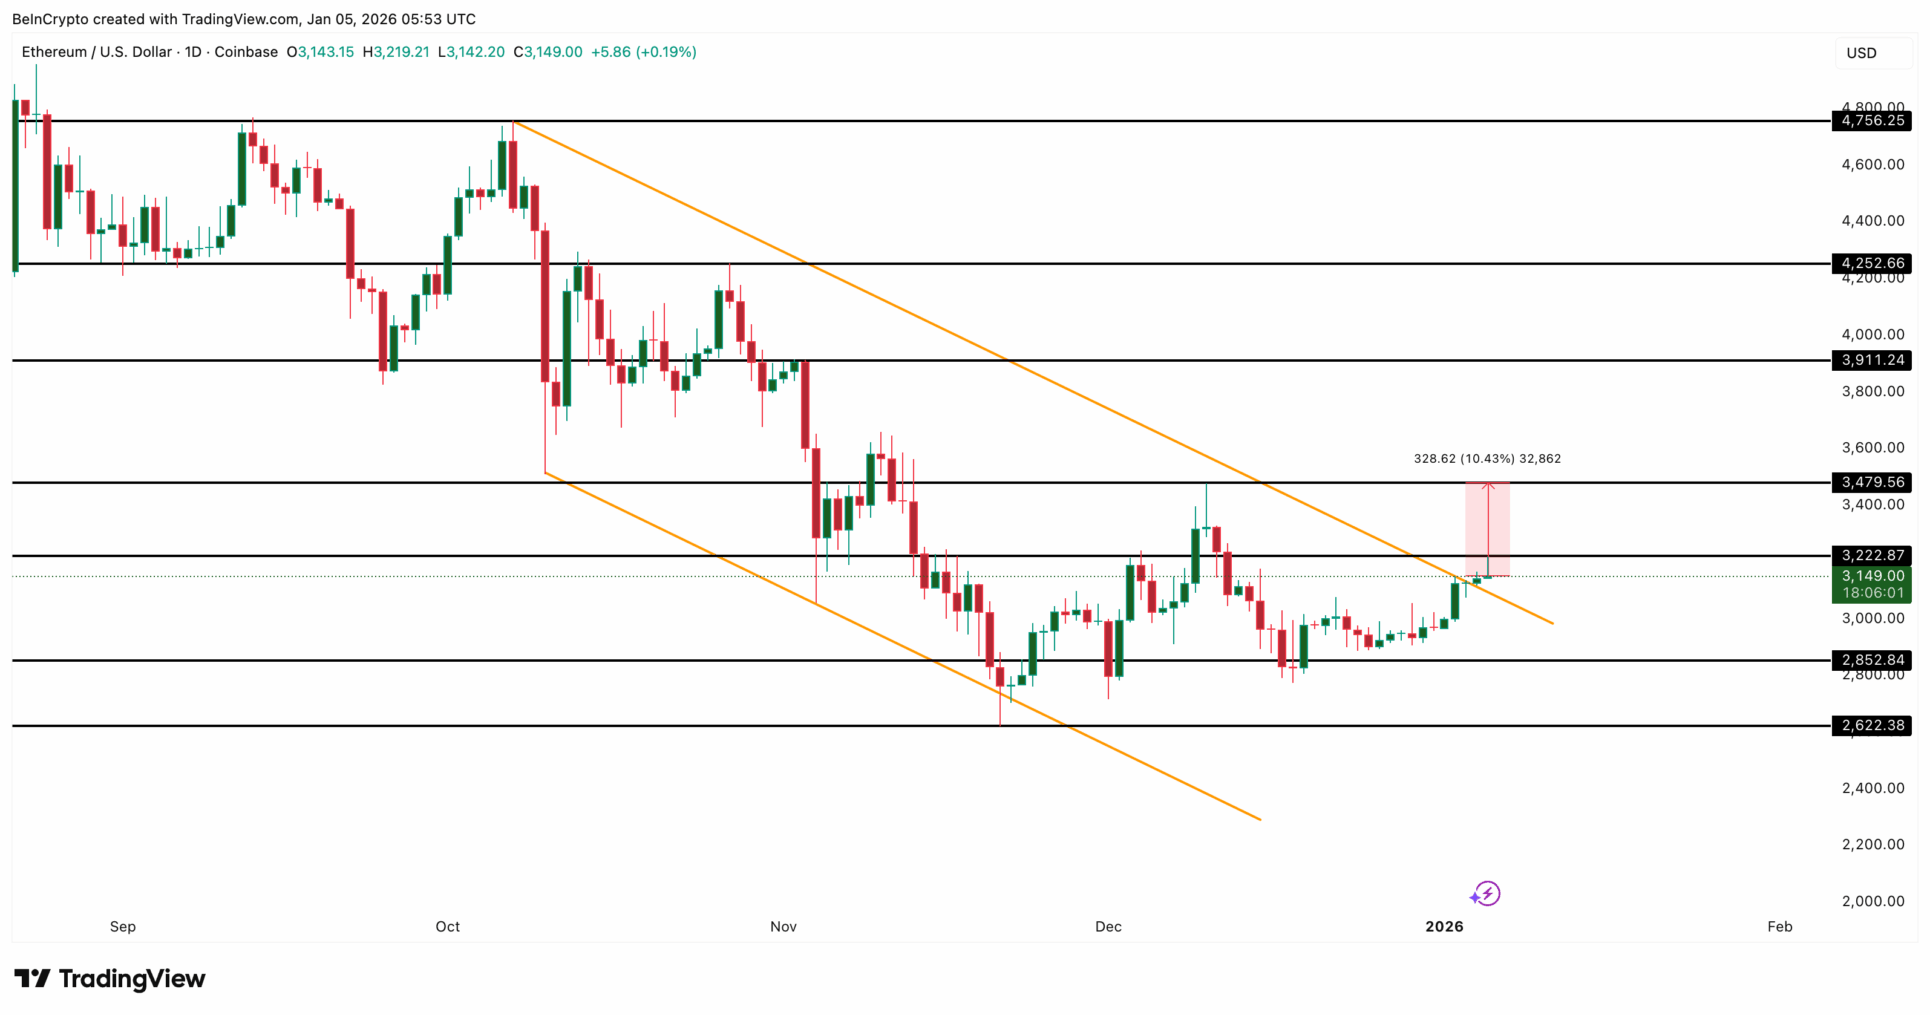
Above that level, space becomes available towards $3,910 and later possibly $4,250. On the downside, a drop below $2,850 seriously weakens the positive scenario and opens the door to lower levels again.
Source: https://newsbit.nl/ethereum-koers-breekt-uit-neerwaarts-kanaal-wat-nu/