The XRP rate is at 2.18 dollars, but according to several graphs and market data, a rally could be 3 dollars. Technical patterns such as a Falling Wedge and Ascending Triangle, together with rising purchasing pressure and a Bullish RSI-Divergency, indicate a possible explosive outbreak in June.
Falling Wedge points on a target of 3.20 dollars
A Falling Wedge pattern can be seen on the weekly graph of XRP, a formation that usually points to a possible trend dominance. The course is currently approaching the upper trend line around $ 2.43. If XRP succeeds in closing above that, the next price target is $ 3.20. That would mean an increase of 45 percent compared to the current level.
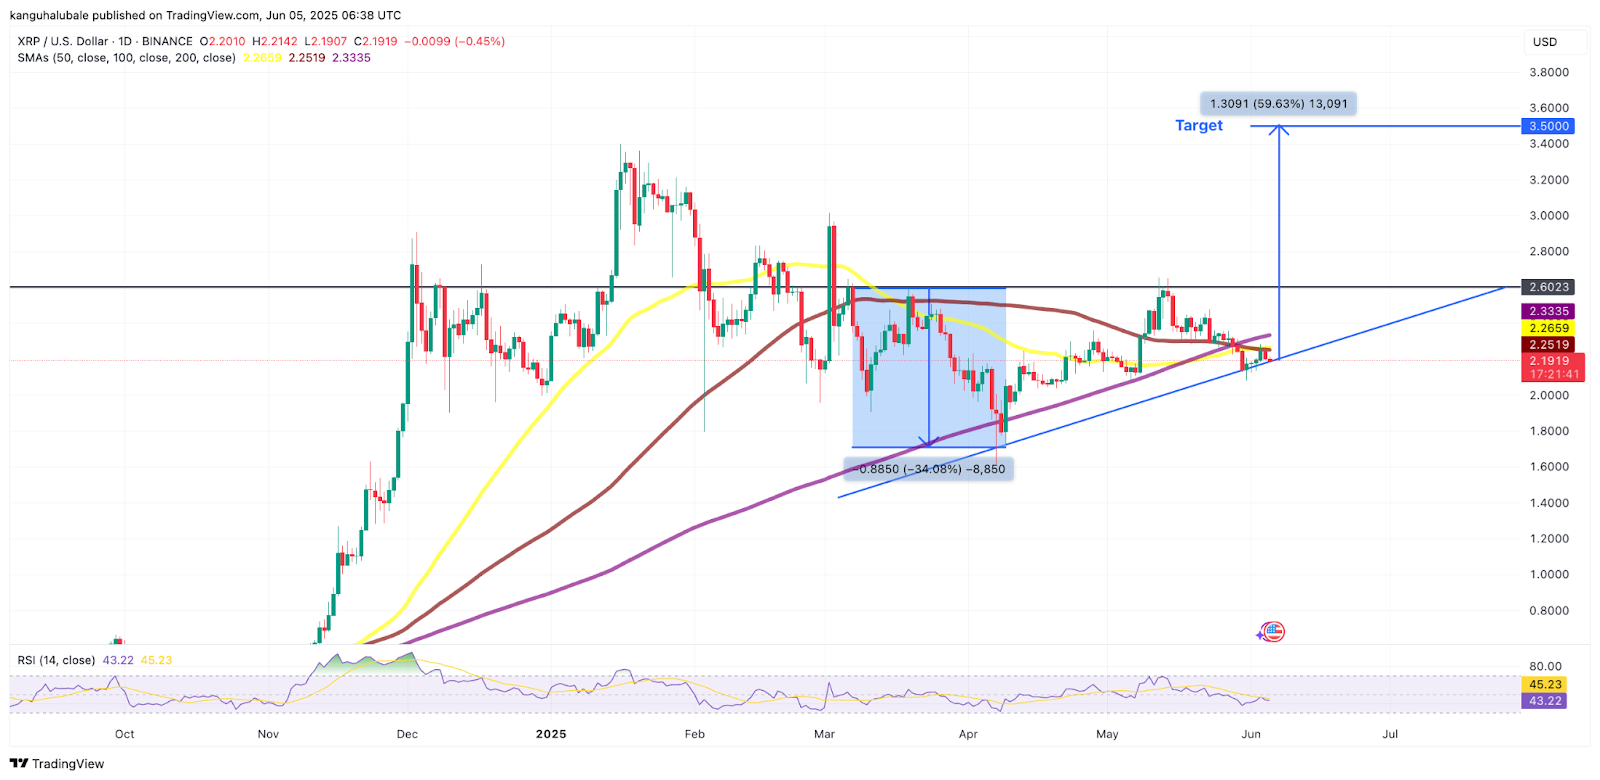
ASCending Triangle points on a target of 3.50 dollars
On the daily graph, XRP forms an Ascending Triangle, a pattern that often indicates a continuation of an upward trend. To confirm this pattern, the course must break around $ 2.60 through the resistance. If that succeeds, then the next target price comes out at $ 3.50. That would mean an increase of around 60 percent compared to the current price level.
The pattern originated after a powerful recovery of 70 percent, from the low point of 1.61 dollars on 7 April. Since then, XRP moves stably above the psychologically important limit of 2 dollars.
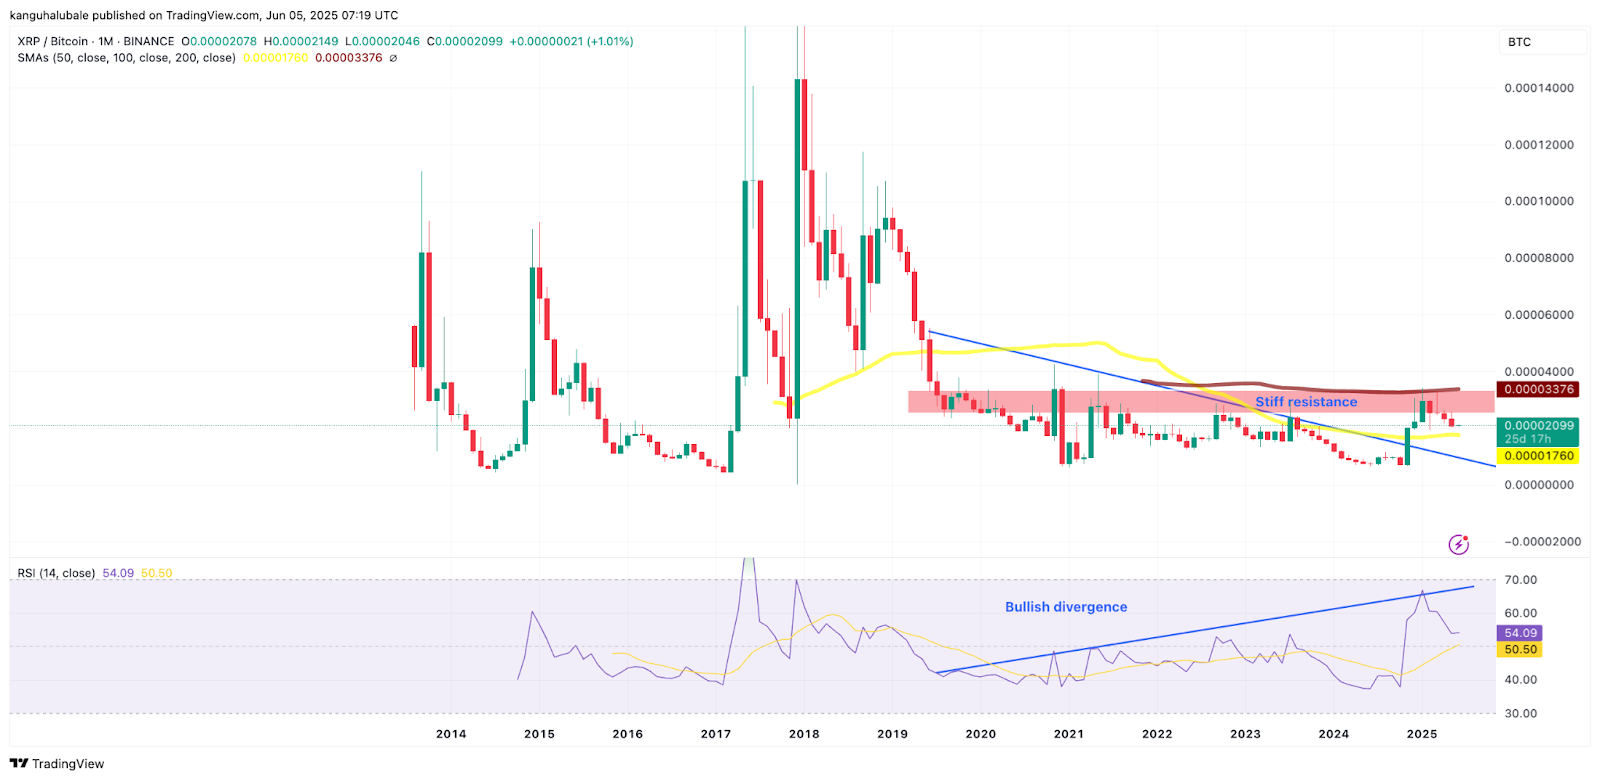
XRP/BTC Divergence and RSI give extra support
The price development of XRP compared to Bitcoin (BTC) also shows a positive image. Since 2019, the XRP/BTC graph has formed lower peaks, while the monthly RSI has risen correctly from 41 to 67. These conflicting movements indicate a bullish divergence, a classic sign that the sales pressure is decreasing and an upward breakthrough is possible.
If XRP succeeds in breaking through the resistance between 0.00002530 BTC and 0.00003375 BTC, there is room for an increase towards 0.00003609 BTC. That would amount to a price increase of approximately 71 percent compared to the current level.
Buyers dominate according to CVD data
Finally, data from cryptoquant shows that the 90-day cumulative volume delta (CVD) is again positive. This means that the number of buying orders is currently greater than the number of sales orders, despite a fall in price of 17 percent since the local peak of 2.65 dollars on 12 May. The cover to buying dominance began on May 19 and is interpreted as a sign of renewed confidence among investors.

As long as the CVD remains positive, this indicates that buyers remain active and anticipate further price increases. Such a buying pressure has been observed more often at the start of earlier XRP rallies.
Psychological limit of 2 dollars remains crucial
Since April 11, XRP has been acting above the psychological limit of 2 dollars. This level acts as strong support. If the course does not drop here, the upward momentum will remain intact. If the limit falls, the next support point is around 1.70 dollars.
Source: https://newsbit.nl/explodeert-de-xrp-koers-deze-maand-naar-3-dollar-deze-4-grafieken-voorspellen-van-wel/