
When analyzing the crypto market, we often pay attention to the prices of Bitcoin (BTC) and Ethereum (ETH) in particular. But there are a number of other graphs that provide a lot of information about the state of the crypto market. These graphs, such as the dominance of the USDT stablecoin (USDT.D), can help make forecasts.
The use of the USDT dominance
The USDT.D chart shows a percentage. This percentage is the total share of USDT tokens within the crypto market. Although there are more stablecoins, USDT is by far the largest. The more traders own USDT, the less capital flows into Bitcoin and altcoin.
Periods of high or rising USDT dominance are therefore often accompanied by broader price corrections in the crypto market: money flows from Bitcoin and altcoins to USDT. A falling USDT.D, on the other hand, is often accompanied by rising prices. Traders convert their USDT into Bitcoin and altcoins.
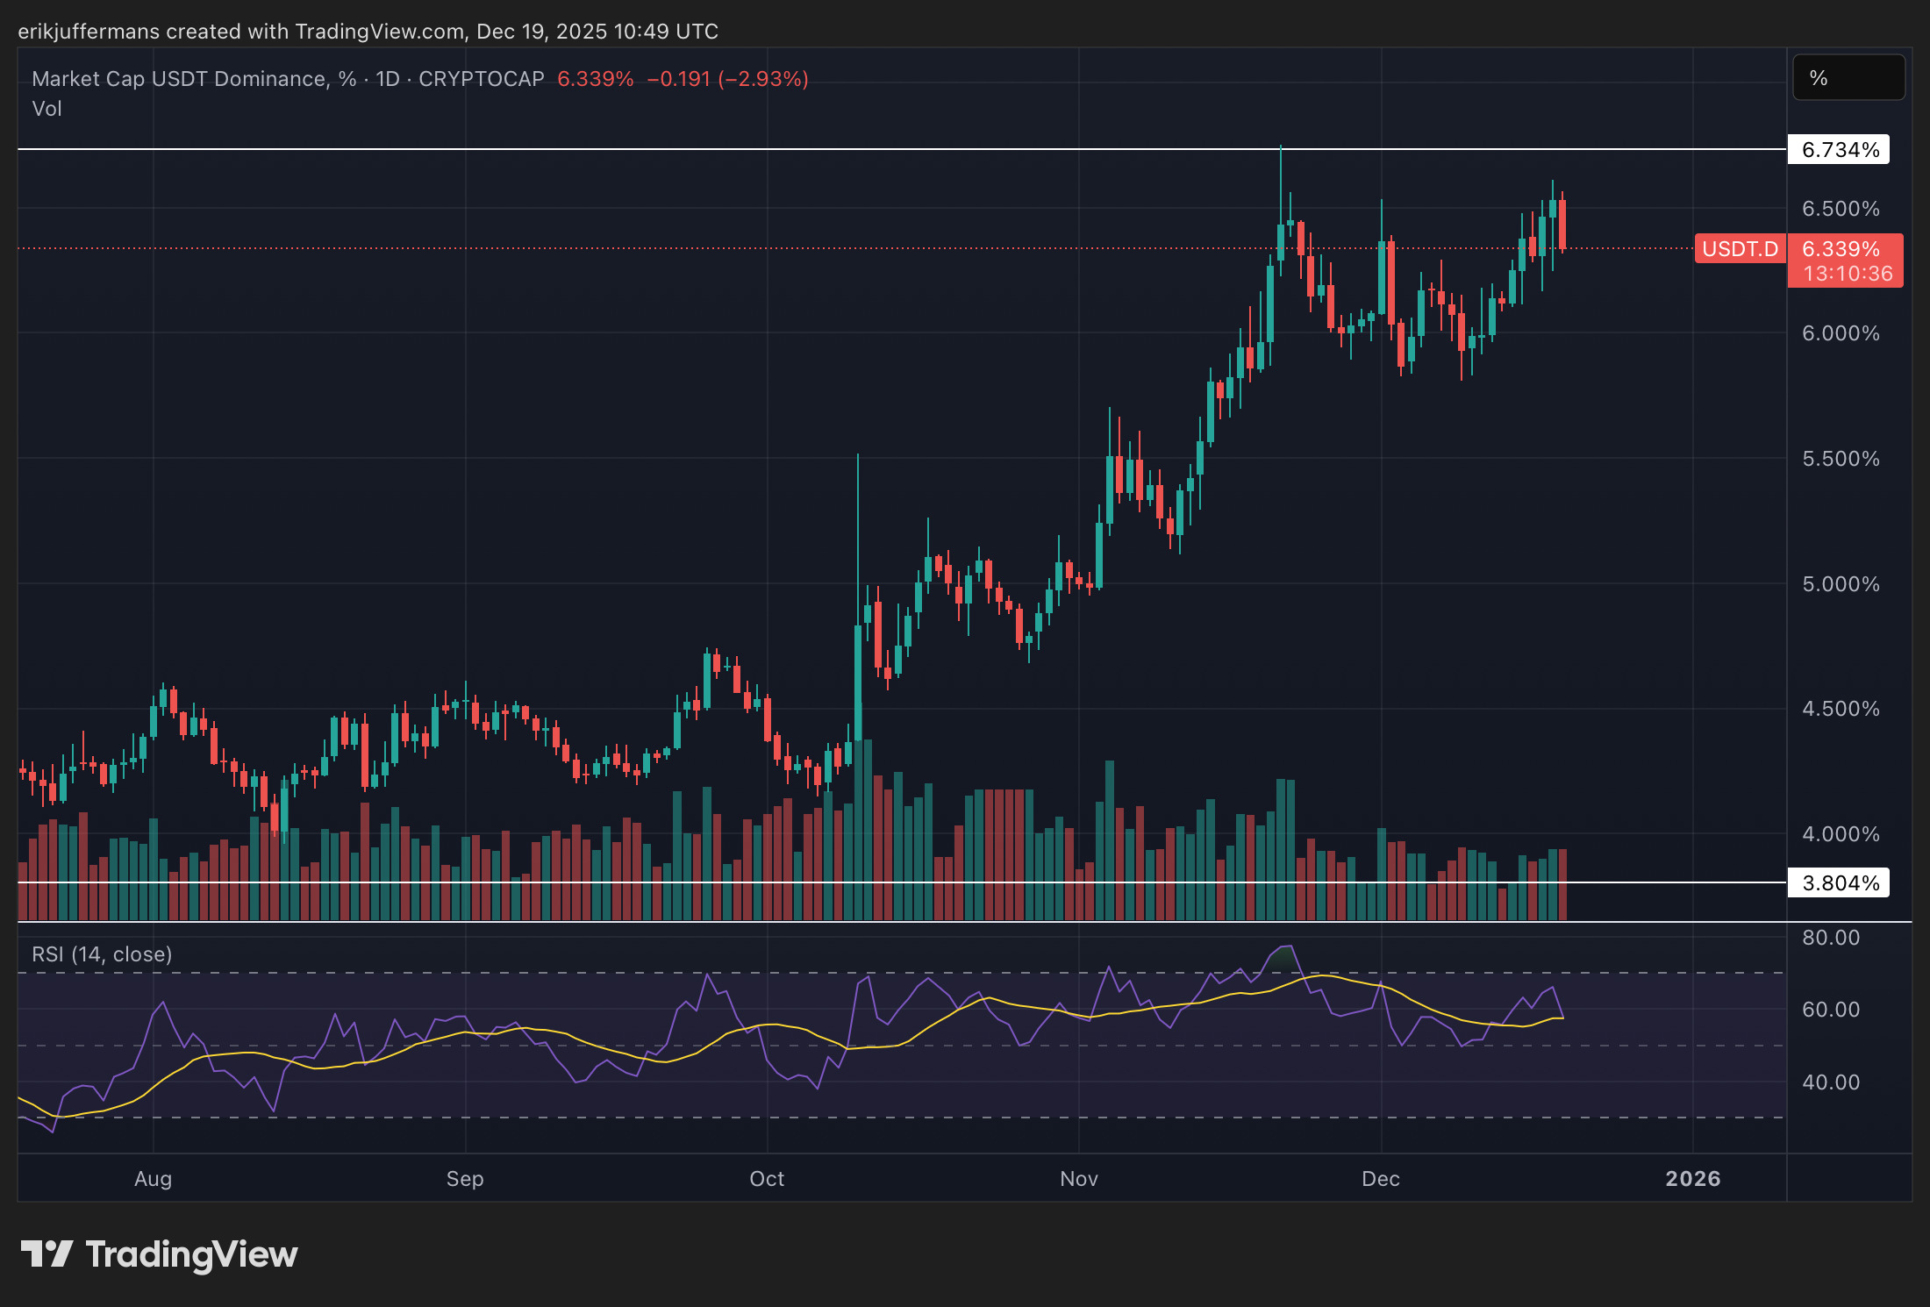
Below you can see the weekly USDT.D chart with some important horizontal levels. Since August, USDT dominance has been on an upward trend. Currently, the USDT.D is over 6 percent. So a lot of money has flowed into USDT in recent months. This partly explains the recent falling prices.
Will the USDT.D fall again?
If the USDT.D were to fall again from this level, it would coincide with rising prices on the crypto market. Earlier in this cycle, the USDT.D also fell from current levels to the horizontal level around 4 percent. This then coincided with a Bitcoin increase of more than 100 percent. Can we now expect a decline in the USDT.D again?
That’s hard to say. We do see signs of a possible top emerging on the daily chart. We see a possible double top developing with a hint of bearish divergence on the RSI indicator. A drop below 6 percent would confirm the breakdown.
Source: https://newsbit.nl/usdt-analyse-deze-grafiek-voorspelde-eerder-100-winst-voor-bitcoin/