Yesterday the crypto market received a nice boost, with Ripple’s XRP also recording a nice increase. The price rose towards $1.50 before falling slightly again. However, a meaningful recovery remains to be seen. Technical analyst Erik Juffermans from Newsbit investigates the current status of the graphs.
Short term remains uncertain for XRP
After rising to $1.50, the XRP price dropped slightly again and is now trading slightly above the zone around $1.40. The daily chart shows that the price has been trading in a narrow range between $1.35 and $1.50 since the beginning of this month. It therefore remains to wait until the price makes a move either up or down compared to this range.
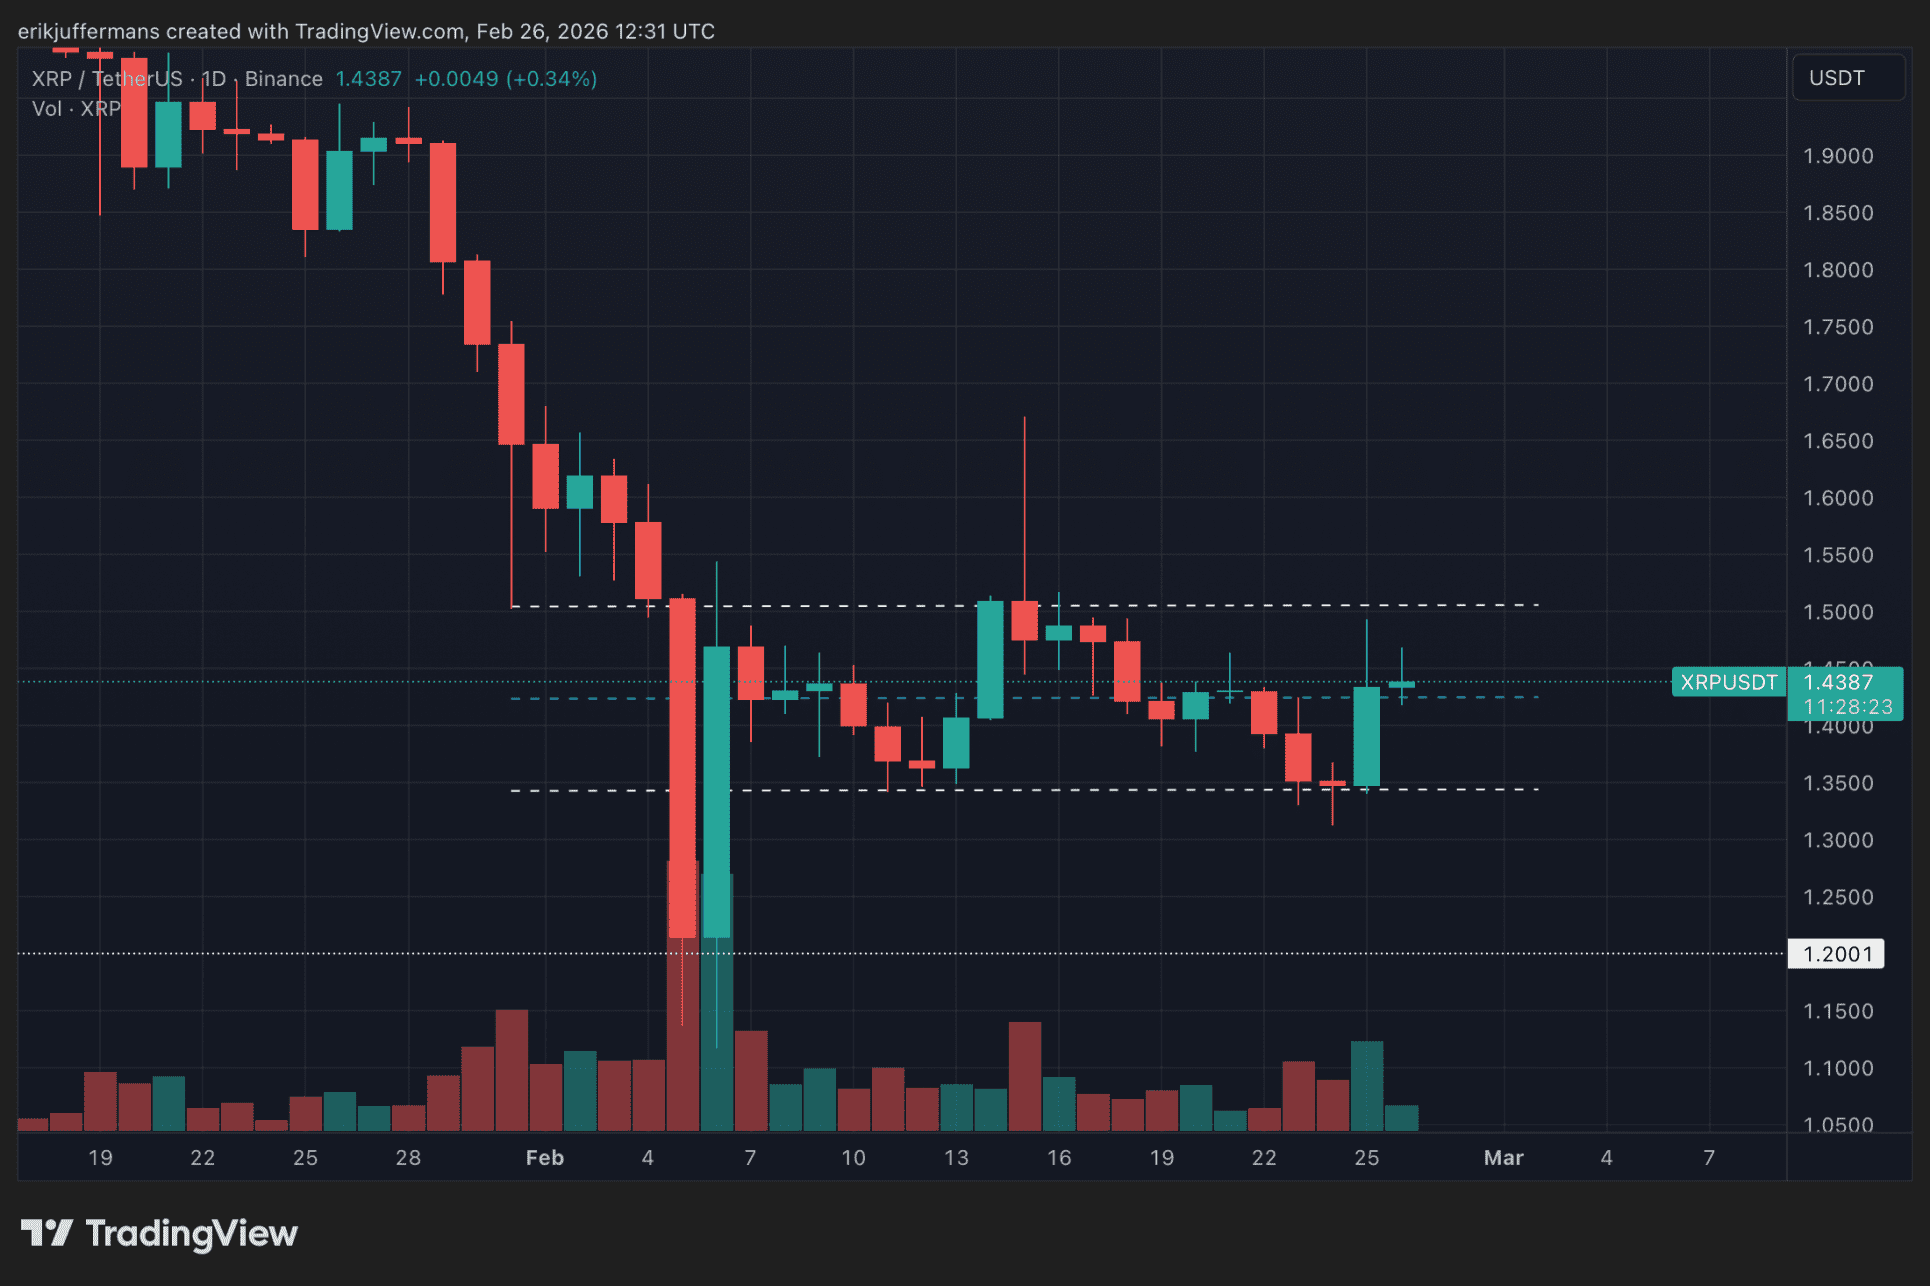
A breakout to the upside could lead to a nice rise towards the zone around $1.80. A first bearish target in the event of a breakdown is the bottom around $1.20. The price development of Bitcoin (BTC) has an influence on the broader crypto market in the short term.
Long-term hope?
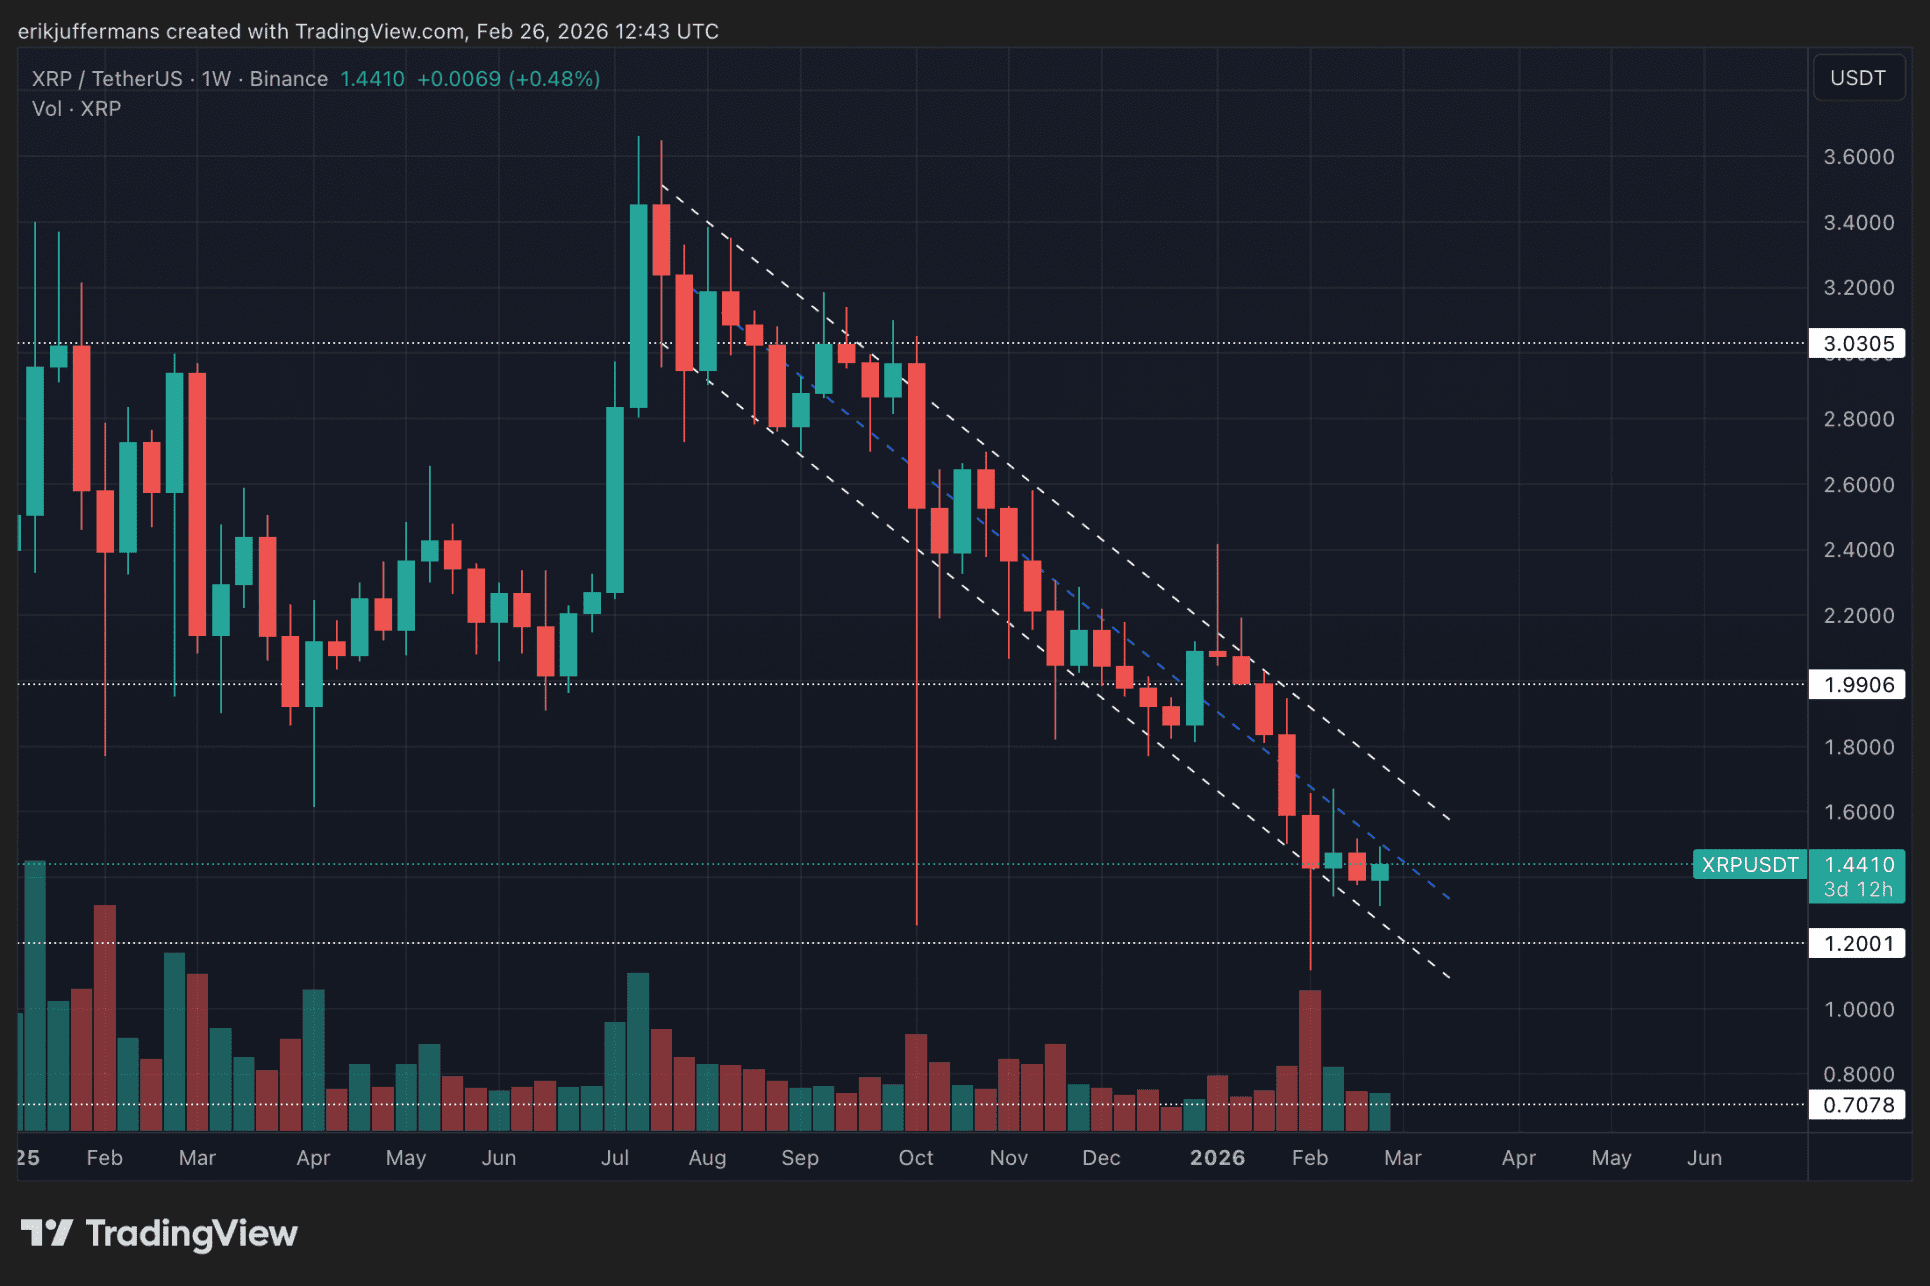
Then let’s look at the weekly graph. As we have already noted in previous analyses, the price is moving in a clear downward channel. The price has been in this channel since the peak of $3.60 in July last year. Until we see a breakout of the top of this channel on the weekly timeframe, we will have to wait and see.
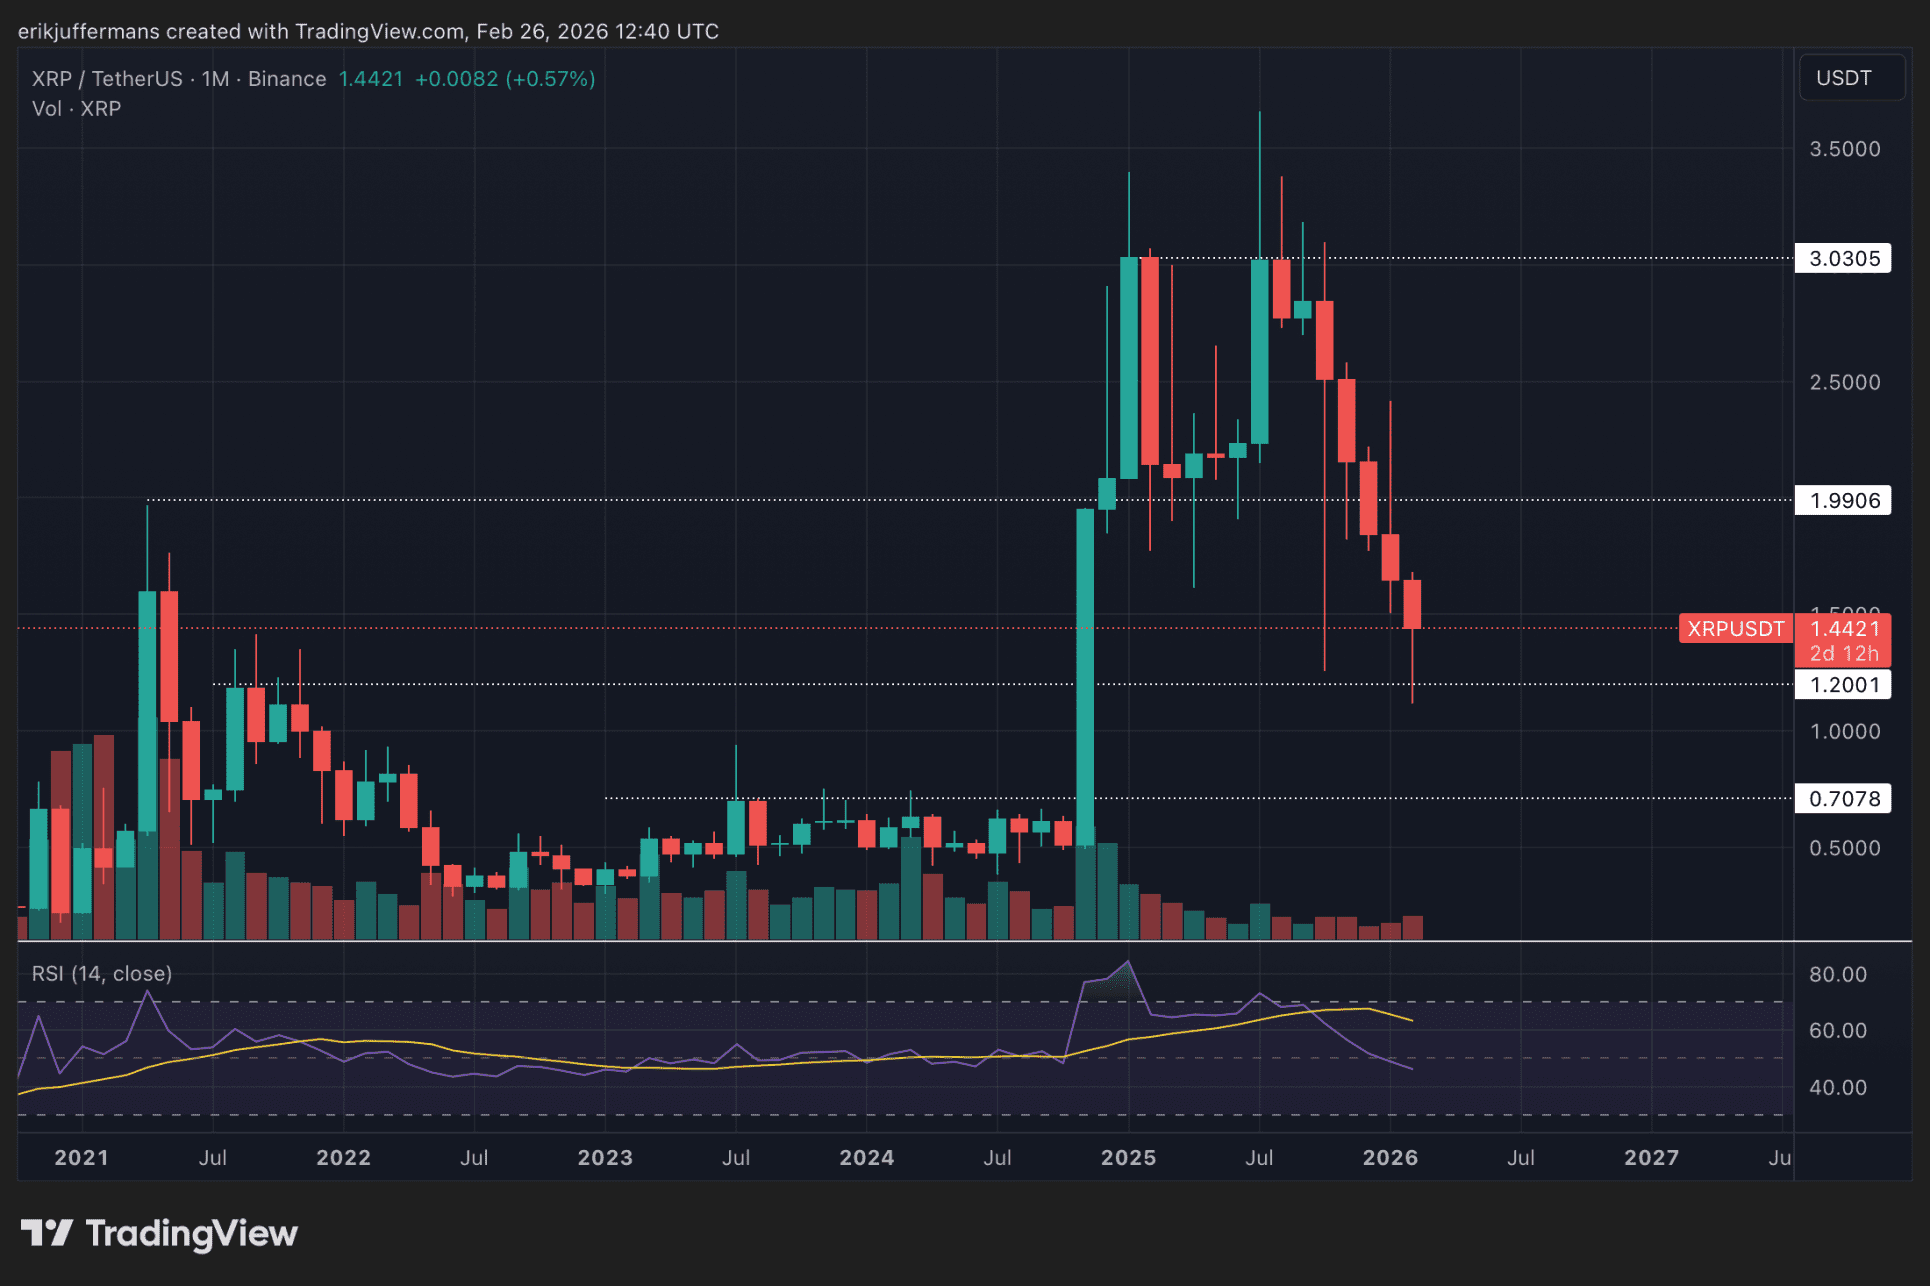
But there is reason for optimism. At least in the long term. The monthly chart below shows four clear key horizontal levels. $1.20 is one of them. The price recently fell to this level and there is a chance that this zone will prove to be a bottom in the future. However, a second decline to this level cannot be ruled out.
Source: https://newsbit.nl/newsbit-analist-xrp-koers-balanceert-op-cruciaal-niveau-na-grote-sprong/